 seolounge
Funnel drop off points are where potential customers leave before completing a desired action, such as booking a call, submitting a form, joining a list, or making a purchase. For many small businesses, the problem is not a lack of website traffic. The real issue is that too many users enter the conversion funnel and disappear before they become leads or customers.
That hidden loss affects your conversion rate, lead generation, customer acquisition, and revenue. A landing page may attract visitors, but weak calls to action, slow load times, poor mobile usability, confusing checkout steps, or missing trust signals can create friction points that cause users to drop.
This guide explains how to identify funnel drop-off points, analyze user behavior, calculate drop-off rate, use analytics tools, and fix the conversion bottlenecks that stop your website from turning more visitors into customers.
Key Takeaways
- Funnel drop-off points reveal where revenue is leaking: When users leave before taking the desired action, your business loses leads, sales, and customer acquisition opportunities that may already be within reach.
- More traffic is not always the answer: Many businesses assume they need more website visitors when the real problem is poor funnel performance, weak user experience, or hidden friction inside the conversion path.
- Analytics tracking shows where users drop: Tools like Google Analytics, funnel charts, Microsoft Clarity, heatmaps, and session recordings help identify user behavior at each stage of your funnel.
- Small fixes can improve conversion rates: Better calls to action, faster load times, clearer navigation, stronger trust signals, simpler forms, and improved checkout options can reduce high drop-off rates.
- Funnel optimization supports long-term growth: Understanding funnel drop-offs helps teams make data-driven decisions, improve conversion rates, and get more value from existing website traffic.
What Are Funnel Drop-Off Points?
Funnel drop-off points are the specific stages in your conversion funnel where users stop moving forward. A drop-off can happen when a website visitor leaves a landing page, skips a call to action, abandons a lead form, exits the checkout process, or fails to complete any other desired action.
Quick Answer: Funnel drop-off points show where users leave the conversion path before becoming a lead or customer. Identifying them helps you find friction, improve user experience, and increase conversion rate without always needing more traffic.
Every marketing funnel has stages. A user may first discover your business through search, social media, paid ads, email, or referral traffic. Then they visit your website, read content, compare options, click a CTA, complete a form, book a consultation, or make a purchase. When many users drop at the same funnel stage, that point becomes a conversion bottleneck.
Understanding funnel drop-offs gives you insight into user behavior throughout the customer journey. Instead of guessing why website conversions are low, you can use funnel analysis, analytics tracking, heatmaps, and session recordings to see where people hesitate, get confused, or leave.
Funnel Problems vs. Traffic Problems

Many businesses blame low leads or sales on a traffic problem, but the real issue is often a funnel problem. A traffic problem means not enough qualified website visitors are entering the top of the funnel. A funnel problem means enough users are arriving, but they are not taking the next step in the conversion process.
For example, an ecommerce store may attract steady website traffic but lose many users in the cart or checkout. A local service provider may get visitors to a service page but receive very few form submissions. A consultant may drive ad clicks to a landing page, but users leave without booking a call. In each case, the issue is not simply visibility. It is friction within the user journey.
This distinction matters because the fix is different. If traffic is too low, you may need stronger search, content, or paid marketing. If funnel drop-off happens after users arrive, you need conversion optimization, better analytics tracking, clearer calls to action, improved user experience, and fewer friction points.
Before spending more on traffic, analyze your funnel performance. Improving existing conversion paths can often boost conversion rates faster than increasing traffic alone.
How Funnel Drop-Off Points Affect Conversion Rate and Revenue
Funnel drop-off points directly affect your conversion rate because every user who leaves before the desired action reduces the percentage of visitors who become leads or customers. Even a small drop-off at a critical funnel stage can create a large revenue gap over time.
Imagine 1,000 users visit a landing page. If 300 click the call to action, 120 start the form, and only 40 submit it, the biggest problem may not be the landing page traffic. The issue may be the form experience, the offer, the fields required, or a technical issue preventing completion. That drop-off analysis gives you a specific point to improve instead of guessing.
High drop-off rates also increase customer acquisition costs. If you are paying for ads, SEO, email, or social media to drive traffic, every lost visitor makes that investment less efficient. The same budget produces fewer leads, fewer sales, and weaker funnel performance.
Effective conversion funnel analysis helps identify where users drop, why they stop, and which fixes can improve conversion rates. When you reduce friction at the right funnel points, you can generate more revenue from the same number of users.
Common Funnel Stages Where Users Drop Off
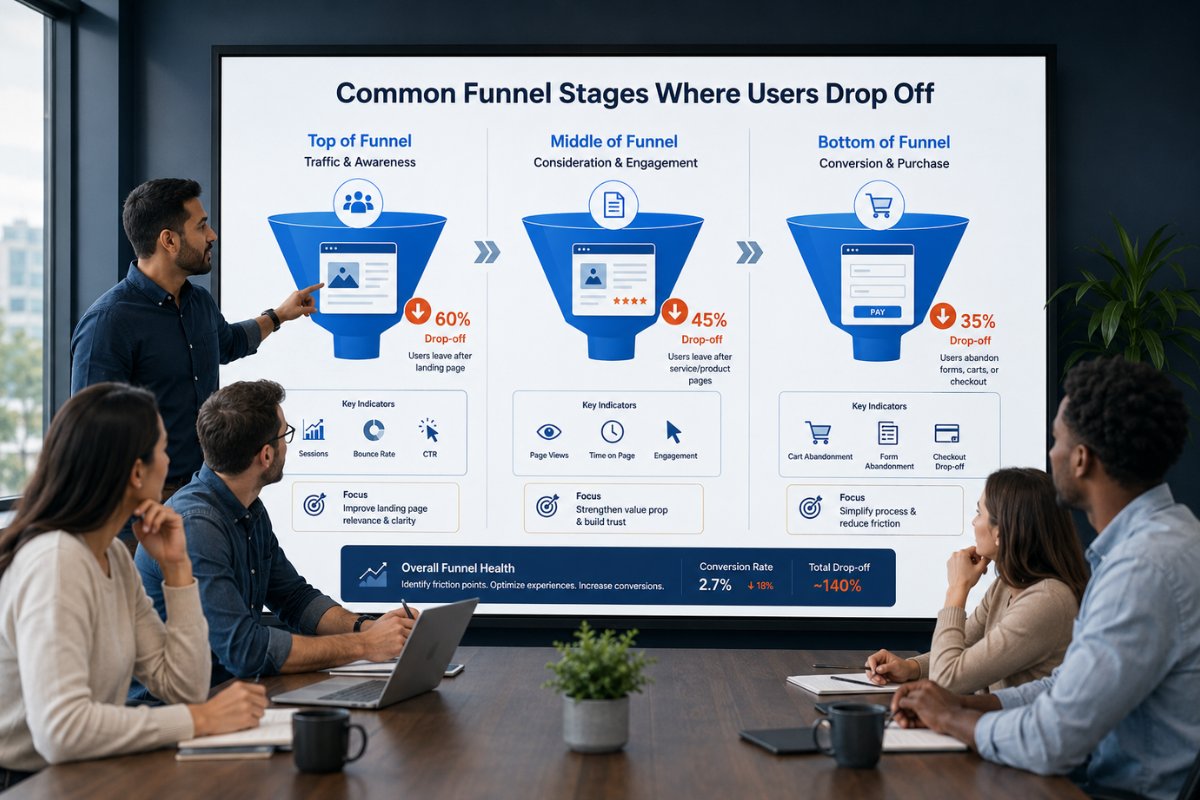
Drop-offs can happen at any stage of the funnel, but most businesses see problems in a few predictable areas. At the top of the funnel, users may leave after landing on a page because the message does not match their search intent, the page loads slowly, or the value proposition is unclear. This often shows up as a high bounce rate or weak visitor engagement.
In the middle of the funnel, users may read a service page, compare options, or view pricing but fail to take the next step. Common friction points include vague benefits, missing proof, confusing navigation, weak calls to action, or content that does not answer the user’s real questions. This stage is where trust and clarity matter most.
At the bottom of the funnel, drop-off happens closest to conversion. Users may abandon forms, leave the cart, exit the checkout process, or hesitate before booking a consultation. These drop-off points are especially costly because the user has already shown strong intent.
Analyzing user behavior at each stage of your funnel makes it easier to see whether users need better information, stronger trust signals, a smoother experience, or fewer steps to complete the desired action.
How to Calculate Funnel Drop-Off Rate
To calculate funnel drop-off rate, compare the number of users who entered one funnel stage with the number of users who moved to the next stage. This metric shows the percentage of customers who stop before continuing through the conversion path.
Formula: Funnel drop-off rate equals users who did not continue divided by users at the previous stage, multiplied by 100.
For example, if 500 users visit a landing page and 200 click the call to action, 300 users dropped off. Divide 300 by 500, then multiply by 100. That gives you a 60 percent drop-off rate between the landing page and CTA click. If 200 users start checkout and 80 complete a purchase, 120 users dropped, creating a 60 percent checkout drop-off rate.
Measuring funnel drop-off helps you identify which stage of the funnel needs attention first. A high drop-off rate near the top of the funnel may indicate poor message match, weak visitor engagement, or slow page speed. A high drop-off near the bottom may point to form friction, checkout abandonment, limited payment options, or missing trust signals.
Once you calculate funnel drop-off at each step, you can prioritize fixes based on impact, not guesswork.
How to Track Funnel Drop-Off Points in Google Analytics
Google Analytics helps you track funnel drop-off points by showing how users move through key actions on your website. Instead of looking only at total website traffic, you can measure specific user actions such as page views, CTA clicks, form starts, form submissions, cart additions, checkout starts, purchases, and consultation bookings.
Start by defining your conversion goals. For a local service provider, that may include contact form submissions, phone clicks, or booked calls. For an ecommerce business, it may include product views, add-to-cart events, checkout starts, and completed purchases. Once those actions are tracked, funnel analysis becomes much more useful.
In Google Analytics funnel reports, you can compare the number of users at each funnel stage and identify where users drop. If many users visit a service page but few click the CTA, the offer or button placement may need improvement. If many users start checkout but fail to complete payment, the checkout process may contain friction.
Good analytics tracking gives you the data collection foundation needed to make data-driven decisions, monitor funnel health, and optimize conversions over time.
How Funnel Charts Reveal Conversion Bottlenecks
Funnel charts make it easier to see where users drop because they turn user behavior into a clear visual sequence. Instead of reviewing disconnected metrics, you can compare each funnel stage side by side and quickly spot the largest loss of users.
For example, a lead funnel may show 2,000 landing page visits, 900 CTA clicks, 350 form starts, and 120 completed submissions. That chart immediately shows two possible bottlenecks: the drop from CTA click to form start and the drop from form start to submission. Without funnel charts, those problems may stay hidden inside general website analytics.
Funnel charts are especially useful when measuring a specific funnel, such as a consultation booking path, ecommerce checkout process, webinar signup sequence, or lead magnet download. They help teams understand the number of users moving through each step and the percentage who stop.
Use funnel charts to compare mobile versus desktop users, traffic sources, landing pages, campaigns, and returning versus new visitors. If mobile users have a much higher drop-off rate, your issue may be mobile optimization. If paid ad traffic drops faster than organic traffic, the message may not match the landing page.
Using Microsoft Clarity, Heatmaps, and Session Recordings to Understand User Behavior
Analytics tools tell you where funnel drop-off happens, but behavior tools help explain why. Microsoft Clarity, heatmaps, and session recordings show how users interact with your product, pages, forms, navigation, and calls to action throughout the customer journey.
Heatmaps reveal where users click, scroll, and spend attention. If visitors ignore your main CTA, stop scrolling before your offer, or repeatedly click a non-clickable element, you may have a user experience problem. These insights into user behavior help identify friction points that standard website analytics may not show.
Session recordings go deeper by showing individual user actions. You may see users hesitate on a form field, reopen a pricing section, struggle with mobile navigation, or abandon checkout after seeing limited payment options. When several recordings show the same pattern, that is a strong signal that a specific funnel stage needs optimization.
Use these tools with purpose. Start with pages that already show high drop-off rates in your funnel data, then review recordings and heatmaps for those pages. This makes analyzing user behavior more efficient and helps you make data-driven decisions instead of reacting to isolated visitor activity.
Top-of-Funnel Drop-Off Examples and Fixes
Top-of-funnel drop-off happens when users leave early in the user journey before they engage deeply with your website. This often occurs on blog posts, homepage visits, paid ad landing pages, search traffic pages, and social media referral pages. At this stage, users may be curious, but they are not yet convinced that your business can solve their problem.
A common example is a website visitor who clicks an ad about “emergency plumbing repair” but lands on a generic homepage. The message does not match the user’s intent, so they bounce. Another example is a blog reader who finishes an article but has no clear next step, internal path, or call to action. The content attracted attention, but the funnel failed to move the user forward.
To reduce top-of-funnel drop-offs, improve message match between the traffic source and landing page. Make the headline clear, explain the value quickly, and place a relevant CTA near the top of the page. Use strong navigation, fast load speed, and helpful content that answers the user’s first question.
At this stage, the goal is not always an immediate sale. The goal is visitor engagement that moves users into the next step of the conversion funnel.
Middle-of-Funnel Drop-Off Examples and Fixes
Middle-of-funnel drop-off happens when users understand their problem but are still deciding whether your business is the right solution. These visitors may view service pages, product categories, pricing details, comparison content, case studies, or lead magnet pages. They are interested, but they need more clarity before taking the next step.
For example, a local service provider may have users reading a service page but leaving before clicking the contact button. The page may explain what the service is, but not why the business is different, what results customers can expect, or what happens after someone reaches out. An ecommerce business may see users browsing product pages but failing to add items to the cart because sizing, shipping, reviews, or return policies are unclear.
To fix middle-of-funnel drop-offs, strengthen the decision-making experience. Add specific benefits, testimonials, reviews, FAQs, process explanations, comparison points, and clear next-step CTAs. Make it easy for users to understand what they get, why it matters, and why they should trust you.
This stage is where conversion optimization and user experience work together. The goal is to reduce uncertainty and move qualified visitors closer to action.
Bottom-of-Funnel Drop-Off Examples and Fixes
Bottom-of-funnel drop-off happens when users are close to converting but stop before completing the final action. This is one of the most important funnel drop-off points to fix because these users have already shown strong intent. They may have added a product to the cart, started the checkout process, opened a booking calendar, or begun filling out a lead form.
A common example is checkout abandonment. A customer may be ready to make a purchase but leave after seeing unexpected shipping costs, limited payment options, forced account creation, or a confusing payment screen. For service businesses, a user may click “book a call” but abandon the process if the calendar is hard to use, the form asks too many questions, or the next step feels unclear.
To reduce bottom-of-funnel drop-offs, remove unnecessary friction. Simplify forms, show pricing expectations when possible, offer multiple payment options, display trust signals near the final CTA, and make the conversion path feel secure. Add testimonials, reviews, guarantees, or short reassurance copy beside important decision points.
At this stage of the funnel, small improvements can boost conversion rates quickly because users are already motivated. Your job is to make the final step easy, trustworthy, and obvious.
Landing Page Drop-Off Points
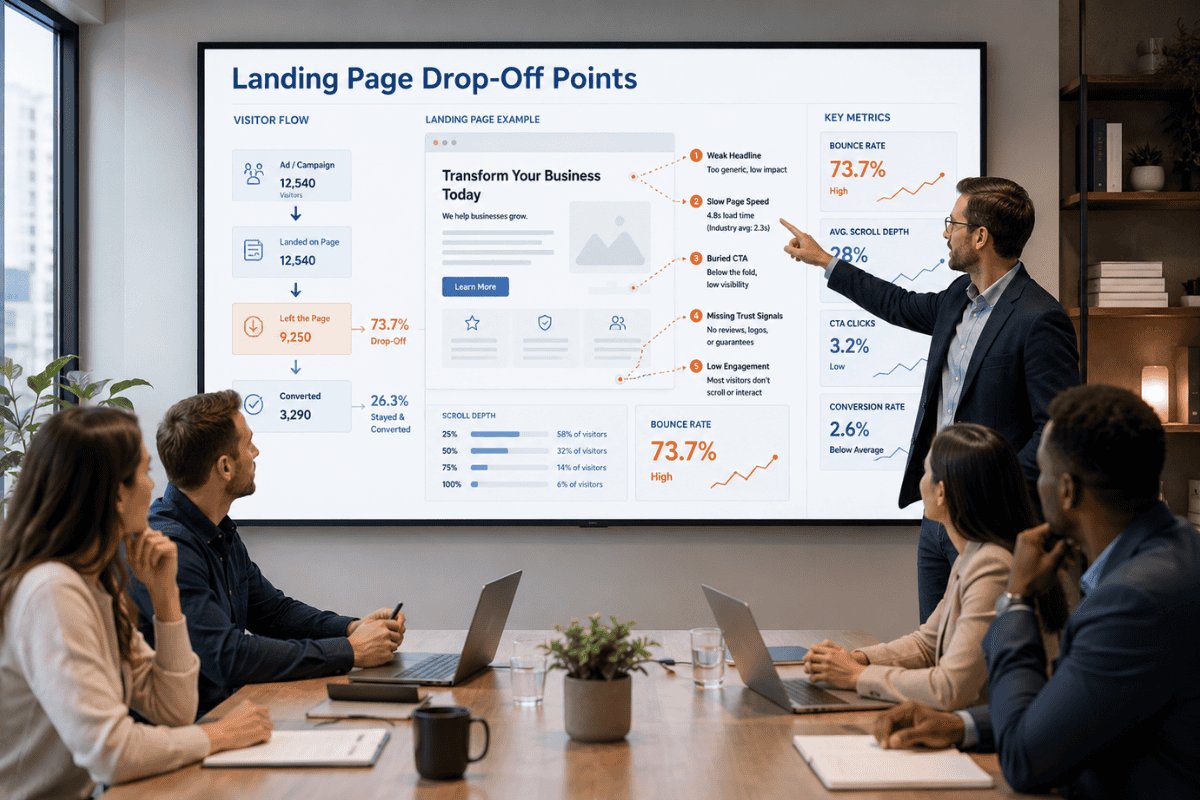
Landing page drop-off points usually happen when the page does not quickly answer three questions: am I in the right place, is this relevant to me, and what should I do next? If users arrive from an ad, search result, email, or social post and the page feels disconnected from their intent, they may leave within seconds.
Common landing page friction includes vague headlines, cluttered layouts, weak offers, slow load speed, missing trust signals, and calls to action that are buried too far down the page. A user who clicked because they wanted a clear solution should not have to work hard to understand the offer.
To identify landing page drop-off, compare bounce rate, scroll depth, CTA clicks, and conversion rate. If many users visit but few scroll or click, the top of the page may not be compelling enough. If users scroll but do not convert, the offer, proof, or CTA may need stronger positioning.
Fix landing page drop-offs by matching the page to the traffic source, writing benefit-driven headlines, placing a clear CTA above the fold, adding reviews or testimonials, and removing distractions that pull users away from the desired action.
Lead Form and Abandoned Form Issues
Lead forms are one of the most common funnel drop-off points for service businesses. A user may be interested enough to request a quote, book a consultation, or download a resource, but abandon the form before submitting it. When that happens, your funnel has created intent but failed to capture the lead.
Abandoned forms often happen because the form asks for too much information too soon. Long forms, unclear field labels, required phone numbers, confusing error messages, or missing privacy reassurance can all create friction. On mobile, even a simple form can become frustrating if fields are hard to tap or the keyboard covers important instructions.
To diagnose form drop-off, track form views, form starts, field interactions, error messages, and completed submissions. If many users start but few finish, review session recordings to see where hesitation happens. A technical issue, broken validation rule, or unclear required field may be costing conversions.
Fix form abandonment by reducing unnecessary fields, using clear labels, adding reassurance near the submit button, and explaining what happens after submission. A simple message like “We’ll respond within one business day” can reduce uncertainty and improve conversion rate.
Ecommerce Checkout Abandonment
Checkout abandonment is a bottom-of-funnel drop-off point where users are close to making a purchase but leave before completing payment. Because these users have already viewed products, added items to the cart, and shown purchase intent, checkout drop-offs can have an immediate impact on revenue.
Common checkout friction includes unexpected shipping costs, limited payment options, forced account creation, unclear delivery timelines, discount code confusion, slow payment pages, and weak trust signals. A customer may like the product but abandon the checkout process if the final step feels risky, inconvenient, or longer than expected.
To identify checkout abandonment, track cart views, checkout starts, payment page visits, failed payment events, and completed purchases. Compare the number of users who enter checkout with the number who finish. If the funnel drop-off rate is high, review the checkout process on desktop and mobile to find usability issues.
Fix checkout drop-offs by offering guest checkout, showing total costs early, adding trusted payment options, simplifying form fields, and placing security signals near payment details. For ecommerce businesses, even small checkout improvements can improve conversion rates because they remove friction at the most valuable stage of the funnel.
UX, Navigation, and Mobile Optimization Problems
Poor user experience can create funnel drop-off points even when the offer is strong. If users cannot quickly find what they need, understand the next step, or move through the page without confusion, they are more likely to leave before converting.
Navigation problems are especially common on service websites. A visitor may want pricing, examples, reviews, or contact details, but the menu may hide important pages or use unclear labels. When users have to guess where to click, friction increases. Strong UX design reduces that uncertainty by making the conversion path simple and obvious.
Mobile optimization is just as important. Many users interact with your website from a phone, and mobile behavior is less patient. Small buttons, crowded layouts, slow-loading images, hard-to-read text, and forms that are difficult to complete can all increase drop-off rates. A funnel that works on desktop may still fail on mobile.
To fix these issues, test your full user journey on multiple devices. Review menus, CTA placement, form usability, page spacing, and checkout steps. If the experience feels slow, cluttered, or confusing, users probably feel the same way. Clear navigation and mobile-friendly design make it easier for visitors to continue through the funnel.
Page Speed and Technical Issues That Increase Drop-Off
Page speed and technical issues can quietly damage funnel performance because users often leave before they ever see your offer. If a landing page, form, cart, or checkout screen takes too long to load, the user experience feels unreliable and the conversion path becomes harder to complete.
Every additional second to load adds friction. A page that loads in 2 seconds usually feels responsive, while a page that takes 3 seconds or more can feel slow enough to interrupt momentum. That delay matters most on mobile, where users may be browsing with weaker connections, smaller screens, and less patience.
Technical issues can also create hidden funnel drop-off points. Broken buttons, failed form submissions, tracking errors, payment bugs, image layout shifts, browser conflicts, and popups that cover CTAs can all stop users from taking the desired action. In analytics, these problems may look like normal abandonment unless you investigate deeper.
To diagnose technical friction, test your most important funnel steps regularly. Review site speed, mobile usability, form validation, checkout function, CTA clicks, and analytics tracking. Then pair website analytics with session recordings to see whether users are encountering errors. Fixing technical issues improves funnel health because it removes barriers that should never exist in the first place.
CTA, Trust Signal, and Social Proof Fixes
Weak calls to action and missing trust signals can create funnel drop-off points even when users are interested. If visitors do not know what to do next, or they do not feel confident enough to act, they may leave without becoming a lead or customer.
A strong CTA should be specific, visible, and aligned with the user’s stage in the funnel. “Contact us” may be too vague for a visitor who wants a clear next step. Better options include “Book a strategy call,” “Get a quote,” “Start your free consultation,” or “See available options.” The CTA should tell users what action to take and what they can expect after clicking.
Trust signals reduce hesitation. Reviews, testimonials, client results, security badges, guarantees, transparent pricing details, and clear contact information all help users feel safer moving forward. For local service providers, social proof near a form or booking button can be especially powerful because it reassures users at the decision point.
Review your conversion funnel and place trust elements where friction is highest. If users drop before submitting a form, add reassurance beside the form. If they abandon checkout, add secure payment messaging, return details, and customer reviews near the payment step.
Funnel Drop-Off Diagnostic Checklist
A funnel drop-off diagnostic checklist helps you review each stage of your funnel without relying on guesswork. Start by choosing one specific funnel to analyze, such as a lead form funnel, ecommerce checkout funnel, consultation booking funnel, or landing page conversion funnel. Then measure how many users enter each stage and how many continue to the next step.
- Confirm that analytics tracking is active for key user actions.
- Identify the main conversion goal for the funnel.
- Calculate the drop-off rate between each funnel stage.
- Compare mobile and desktop funnel performance.
- Review bounce rate, scroll depth, CTA clicks, and form starts.
- Check heatmaps to see where users click, pause, or ignore important elements.
- Watch session recordings for hesitation, confusion, and technical issues.
- Test forms, checkout steps, payment options, and booking tools manually.
- Review page speed, especially on mobile devices.
- Look for weak trust signals near high-friction decision points.
This checklist helps identify friction points that affect conversion rate, visitor engagement, and lead generation. Once you find the largest drop-off point, prioritize the fix that is closest to revenue. A bottom-of-funnel issue often deserves attention before a minor top-of-funnel improvement.
Step-by-Step Funnel Audit Process
A funnel audit helps you move from “people are not converting” to a clear list of problems, priorities, and fixes. Begin by mapping the entire funnel from the first website visit to the final desired action. Include every step users take, such as landing page view, product view, CTA click, form start, checkout start, payment completion, or booked consultation.
Next, collect funnel data from your analytics tools. Measure the number of users at each stage, calculate funnel drop-off rate, and identify the point where the largest percentage of users drop. Do not assume the first drop is the most important. A smaller drop-off near checkout, booking, or form submission may have a bigger revenue impact.
After identifying the highest-impact stage, review user behavior. Use heatmaps to see what users notice, session recordings to see where they hesitate, and website analytics to compare devices, traffic sources, and conversion paths. Then inspect the page or step manually for technical issues, weak CTAs, poor UX, unclear copy, or missing trust signals.
Finally, choose one fix, test it, and measure the result. Effective funnel analysis is not a one-time task. It is an ongoing optimization process.
Common Funnel Drop-Off Points, Likely Causes, and Recommended Fixes
Because table tags are not part of the approved HTML format, use this structured list as a WordPress-friendly replacement for a funnel drop-off reference table. It gives you the same diagnostic value while keeping the article clean and compliant.
- Landing page bounce: Likely causes include poor message match, slow load speed, weak headline, or unclear value. Recommended fix: align the page with search intent, improve the opening copy, and place a clear CTA near the top.
- Low CTA clicks: Likely causes include vague button text, poor placement, or competing page distractions. Recommended fix: use action-focused CTA copy and repeat it naturally throughout the page.
- Abandoned forms: Likely causes include too many fields, confusing labels, or missing reassurance. Recommended fix: simplify the form and explain what happens after submission.
- Cart abandonment: Likely causes include surprise costs, limited payment options, or forced account creation. Recommended fix: show total costs early and offer guest checkout.
- Booking drop-off: Likely causes include unclear availability, too many steps, or weak trust signals. Recommended fix: simplify scheduling and add testimonials near the booking CTA.
This type of drop-off analysis helps teams connect user behavior to practical conversion optimization steps instead of treating every funnel problem the same way.
A/B Testing Strategies to Reduce Drop-Offs
A/B testing helps you reduce funnel drop-offs by comparing one version of a page, form, CTA, or checkout step against another. Instead of guessing which change will improve conversion rate, you test a specific idea and measure how users respond.
Start with the funnel stage that has the highest-impact drop-off. If users leave a landing page without clicking, test the headline, CTA wording, hero section, offer, or proof placement. If many users start a form but do not finish, test fewer fields, clearer labels, different button text, or reassurance copy near the submit button. If checkout abandonment is high, test payment options, shipping information, guest checkout, or trust messaging.
The strongest tests are simple and focused. Do not change five elements at once, because you will not know which change caused the result. Test one meaningful variable, collect enough data, and compare conversion metrics before making a permanent decision.
A/B testing works best when paired with funnel analysis. Analytics tracking tells you where users drop, while testing helps you learn which optimization strategy reduces friction. Over time, these small improvements compound, helping you boost conversion rates from existing website traffic.
Lead Nurturing for Visitors Who Do Not Convert Immediately
Not every user who enters your funnel is ready to convert on the first visit. Some visitors need more information, more trust, more time, or a better reason to act. That is why lead nurturing is an important part of funnel optimization. It gives you a way to continue the customer journey after the first interaction.
For service businesses, lead nurturing may include follow-up emails after a guide download, reminder messages after a consultation inquiry, or educational content that answers common objections. For ecommerce businesses, it may include abandoned cart emails, product recommendations, limited-time offers, or post-visit retargeting campaigns.
The goal is to keep qualified users engaged instead of losing them forever. A visitor who does not book today may still become a customer next week if your follow-up content is relevant, helpful, and timed correctly.
To improve lead nurturing, create clear paths for users who are not ready to buy. Offer a checklist, newsletter, comparison guide, or helpful resource. Then track how those leads move through the marketing funnel over time. Strong nurturing turns delayed decisions into future conversion opportunities.
How to Monitor Funnel Health Over Time
Funnel health should be monitored regularly because user behavior, traffic sources, competitors, technology, and customer expectations change over time. A funnel that performs well today may develop new drop-off points later if a page slows down, a form breaks, an ad message changes, or mobile users begin behaving differently.
Start by tracking the same core conversion metrics every month. Review website traffic, bounce rate, CTA clicks, form starts, completed submissions, cart additions, checkout starts, purchases, booked calls, and overall conversion rate. Then compare those numbers against previous periods to see whether funnel performance is improving, declining, or staying flat.
Watch for sudden changes. A sharp drop in form submissions may signal a technical issue. A rising bounce rate on one landing page may point to weak message match or slow page speed. A checkout drop-off increase may reveal payment friction, shipping concerns, or trust problems.
Funnel monitoring also helps you make data-driven decisions about marketing spend. Before investing more in traffic, review whether existing visitors are converting efficiently. Strong funnel health means your business gets more value from every campaign, channel, and website visitor.
Why Funnel Optimization Often Beats More Traffic
More traffic can help growth, but it is not always the highest-ROI move. If your funnel has major drop-off points, sending more website visitors into the same broken conversion path simply creates more lost opportunities. The business spends more on SEO, ads, social media, or email, but the conversion rate stays weak.
Funnel optimization improves the value of the traffic you already have. For example, if a landing page receives 1,000 visits and converts at 2 percent, it generates 20 leads. If conversion optimization raises that rate to 4 percent, the same traffic produces 40 leads. That improvement can double lead generation without doubling ad spend or website traffic.
This is why understanding funnel drop-offs is so valuable for small businesses. It helps you focus on the moments that matter most: the landing page headline, the CTA, the form, the checkout process, the trust signals, and the user experience before conversion.
More traffic should come after the funnel is healthy. When your conversion path is clear, fast, trustworthy, and easy to use, every marketing channel performs better. Funnel optimization turns existing visitor engagement into measurable growth.
Book a Strategy Consultation With Innovative Flare
If visitors are entering your funnel but not converting, there is a reason. The issue may be a weak landing page, unclear CTA, abandoned form, checkout friction, poor mobile experience, slow load speed, missing trust signals, or analytics tracking that does not reveal the full customer journey.
Innovative Flare helps small businesses identify funnel drop-off points, understand user behavior, and build conversion-focused strategies that turn more website visitors into leads and customers. Instead of guessing where users drop, we look at funnel data, user actions, conversion metrics, and real friction points across your website.
That process helps uncover the bottlenecks affecting lead generation, sales, and revenue. Once those issues are clear, your business can prioritize fixes that improve conversion rate before spending more on traffic.
If your funnel is leaking opportunities, now is the time to fix it. Let’s identify the bottlenecks, remove the friction points, and create a smarter conversion path for your customers. Book your strategy call today.
FAQs About Funnel Drop-Off Points
What are funnel drop-off points?
Funnel drop-off points are the stages where users leave before completing a desired action. This may happen on a landing page, lead form, cart, checkout page, booking tool, or any other step in the conversion funnel. Identifying these points helps you understand where users stop and what needs to be fixed.
How do you identify funnel drop-off points?
You identify funnel drop-off points by tracking user actions at each funnel stage. Use website analytics, Google Analytics funnel reports, heatmaps, session recordings, form tracking, and checkout data to compare how many users enter each step versus how many continue. The largest drop-off usually signals a friction point or conversion bottleneck.
What is a good funnel drop-off rate?
There is no universal good funnel drop-off rate because it depends on the industry, offer, traffic source, device, and funnel stage. Top-of-funnel drop-off is usually higher than bottom-of-funnel drop-off. The most important goal is to compare your own funnel performance over time and reduce unnecessary abandonment at critical steps.
How do you calculate funnel drop-off rate?
Calculate funnel drop-off rate by subtracting the number of users who moved forward from the number of users at the previous stage. Then divide that number by the users at the previous stage and multiply by 100. This gives you the percentage of users who stopped before reaching the next step.
Why do users drop off during checkout?
Users often drop off during checkout because of unexpected costs, limited payment options, forced account creation, slow pages, confusing form fields, unclear shipping timelines, or weak trust signals. Ecommerce businesses can reduce checkout abandonment by simplifying the process and making the final purchase step feel secure.
Can bounce rate show funnel problems?
Bounce rate can show funnel problems when users leave a page without engaging, but it needs context. A high bounce rate on a blog post may not always be bad if users find the answer they need. A high bounce rate on a landing page, service page, or paid ad page is more concerning because it may signal poor relevance or weak user experience.
What tools help find funnel drop-offs?
Useful tools include Google Analytics for funnel analysis, Microsoft Clarity for session recordings and heatmaps, ecommerce analytics for cart and checkout behavior, and form tracking tools for abandoned forms. Together, these tools help reveal both where users drop and why they may be leaving.
How often should you analyze your funnel?
Review funnel performance monthly for general monitoring and immediately after major website, campaign, offer, or checkout changes. High-traffic funnels may need weekly review. Regular analysis helps catch technical issues, rising drop-off rates, and new friction points before they hurt lead generation or revenue.
